반응형
✔️ 필요성
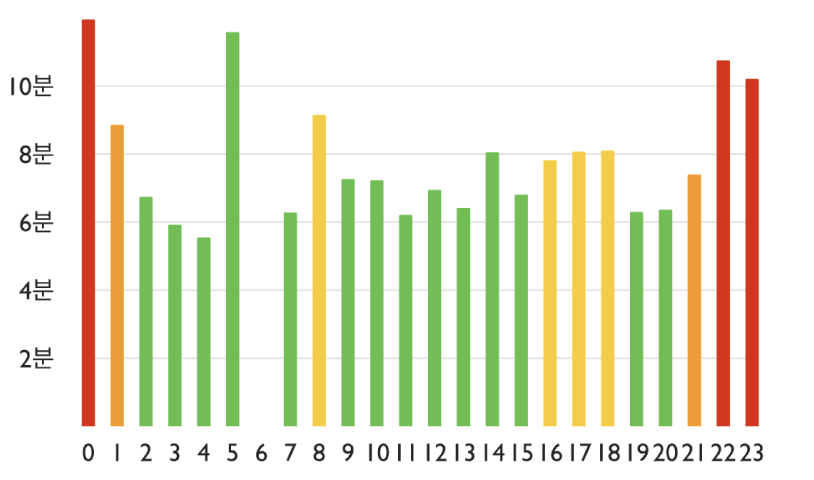
Victory Native에서 x축과 y축을 예쁘게 꾸며봅시다

✔️ x축 꾸미기
x축은 모든 숫자가 다 label로 나오게 하고 싶고, tick과 x축은 보이지 않게 하고 싶다.
<VictoryAxis
    crossAxis
    style={{
      axis: {stroke: 'transparent'},
      ticks: {stroke: 'transparent'},
      tickLabels: {fontSize: 12, padding: 5},
    }}
    tickValues={range(0, 24)}
  />
✔️ y축 꾸미기
y축은 위치를 offsetX를 통해서 약간 이동시킨 다음에, 초를 분으로 바꿔서 2분 단위로 label이 나타나기를 원한다. 그리고 옅은 회색으로 보조선을 그리고 싶다. (grid)
<VictoryAxis
    dependentAxis
    style={{
      axis: {stroke: 'transparent'},
      ticks: {stroke: 'transparent'},
      tickLabels: {fontSize: 12, padding: 5},
      grid: {stroke: theme.colors.lightGrey},
    }}
    offsetX={50}
    tickValues={[120, 240, 360, 480, 600]}
    tickFormat={value => `${secondsToMinute(value)}`}
  />
✔️ 통합 예제 코드
import React from 'react';
import styled from 'styled-components/native';
import {VictoryAxis, VictoryBar, VictoryChart} from 'victory-native';
import {range} from 'lodash';
import {theme} from '~/theme';

<VictoryChart
  width={420}
  height={240}
  padding={{top: 30, bottom: 20, right: 50, left: 60}}>
  <VictoryAxis
    crossAxis
    style={{
      axis: {stroke: 'transparent'},
      ticks: {stroke: 'transparent'},
      tickLabels: {fontSize: 12, padding: 5},
    }}
    tickValues={range(0, 24)}
  />
  <VictoryAxis
    dependentAxis
    style={{
      axis: {stroke: 'transparent'},
      ticks: {stroke: 'transparent'},
      tickLabels: {fontSize: 12, padding: 5},
      grid: {stroke: theme.colors.lightGrey},
    }}
    offsetX={50}
    tickValues={[120, 240, 360, 480, 600]}
    tickFormat={value => `${secondsToMinute(value)}`}
  />
</VictoryChart>
반응형
'차트라이브러리 > Victory Native' 카테고리의 다른 글
| [차트] Add SVG on Victory Chart (0) | 2023.04.28 |
|---|---|
| [차트] Victory / 'VictoryScatter'은(는) JSX 구성 요소로 사용할 수 없습니다. (0) | 2023.04.28 |
| [차트] Victory Native로 multi line 차트 그리기 (0) | 2021.12.21 |
| [Victory Native] multi line 차트 그리기 (0) | 2021.12.21 |
| [차트] Victory Native 활용 예제 파헤치기 (0) | 2021.12.11 |