✔️ Victory Native 활용 예제 파헤치기
Victory Native 개인적으로 너무 만족스러운 라이브러리이다. 무엇보다 가볍고 사용법이 직관적이고, 기본적으로 제공하는 옵션들도 다양하다.
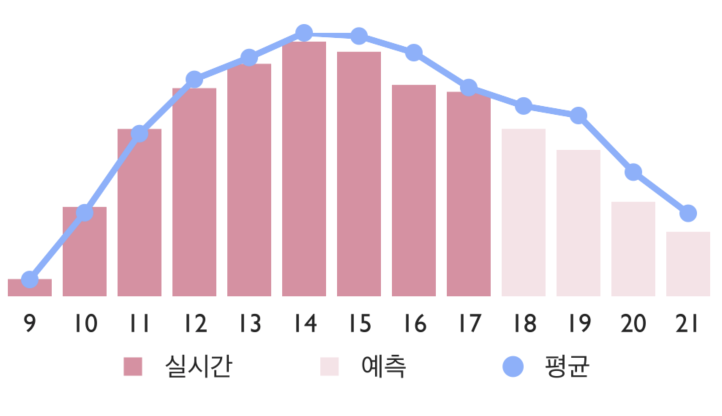
Victory Native로 그린 아래 차트를 어떻게 그렸는지 기록해두고, 내가 라이브러리 사용할 때마다 찾아보려고 한다.
✔️ 전체 코드
import React from 'react';
import {View} from 'react-native';
import styled from 'styled-components/native';
import {
  VictoryAxis,
  VictoryBar,
  VictoryChart,
  VictoryGroup,
  VictoryLegend,
  VictoryLine,
  VictoryScatter,
  VictoryStack,
} from 'victory-native';

const ChartShoppingmall = () => {
  return (
    <View>
      <VictoryChart width={400} height={220}>
        <VictoryAxis
          style={{
            axis: {stroke: 'transparent'},
            ticks: {stroke: 'transparent'},
            tickLabels: {fontSize: 12, padding: 5},
          }}
          tickFormat={time => `${getHour(time)}`}
        />
        <VictoryStack colorScale={[theme.colors.pink, theme.colors.lightPink]}>
          <VictoryBar standalone={false} data={today} barWidth={20} />
          <VictoryBar standalone={false} data={todayPred} barWidth={20} />
        </VictoryStack>
        <VictoryGroup data={stat} standalone={false}>
          <VictoryLine
            style={{
              data: {
                stroke: theme.colors.lightPurple,
                strokeWidth: 3,
              },
            }}
          />
          <VictoryScatter
            size={4}
            style={{data: {fill: theme.colors.lightPurple}}}
          />
        </VictoryGroup>
        <VictoryLegend
          x={80}
          y={190}
          orientation="horizontal"
          gutter={{left: 5, right: 50}}
          style={{
            border: {stroke: 'white'},
            title: {fontSize: 20},
            labels: {fontSize: 12},
          }}
          data={[
            {
              name: '실시간',
              symbol: {fill: theme.colors.pink, type: 'square'},
            },
            {
              name: '예측',
              symbol: {fill: theme.colors.lightPink, type: 'square'},
            },
            {
              name: '평균',
              symbol: {fill: theme.colors.lightPurple, type: 'point'},
            },
          ]}
        />
      </VictoryChart>
    </View>
  );
};

export default ChartShoppingmall;
✔️ 축 조정하기
축은 크게 x축(tick) y축(axis) 로 이루어져있는데 나는 y축은 아예 지웠고 x축 label만 남겨두고 글자 사이즈를 조정했다.
tickFormat에 함수를 넣어서 원하는 label 형태가 나오도록 바꿔주었다!
<VictoryAxis
  style={{
    axis: {stroke: 'transparent'},
    ticks: {stroke: 'transparent'},
    tickLabels: {fontSize: 12, padding: 5},
  }}
  tickFormat={time => `${getHour(time)}`}
/>
✔️ stacked bar 차트
그냥 Bar 차트 하나로 그린 다음에 차트 색상을 다이나믹하게 변화시켜서 그릴 수도 있지만, 들어오는 데이터의 형태에 따라서 stacked bar 차트로 그리는 것이 쉬워서 선택했다.
theme.colors 로 쓸 수 있는 것은 모두 styled-componts 덕분
<VictoryStack colorScale={[theme.colors.pink, theme.colors.lightPink]}>
	<VictoryBar standalone={false} data={today} barWidth={20} />
	<VictoryBar standalone={false} data={todayPred} barWidth={20} />
</VictoryStack>
✔️ 라인차트 + anchor
라인 차트의 옵션에서 anchor 표현을 지정할 수 있는 경우가 많은데 Victory Native에서는 특이하게 scatter plot과 group을 해야 한다.
<VictoryGroup/> 태그에서 같은 데이터를 쓴다는 것을 지정하고 (필수는 아니지만 코드가 깔끔하다) 태그의 내부에서 <VictoryLine/>과 <VictoryScatter/>을 함께 썼다.
찾아보는데 오래 걸렸지만 오히려 더 직관적인 방법인 것 같다.
<VictoryGroup data={stat} standalone={false}>
  <VictoryLine
    style={{
      data: {
      stroke: theme.colors.lightPurple,
      strokeWidth: 3,
      },
    }}
  />
  <VictoryScatter
    size={4}
    style={{data: {fill: theme.colors.lightPurple}}}
  />
</VictoryGroup>
✔️ 범례 (legend)
범례를 추가하고 싶다면 <VictoryLegend/> 태그를 추가하면 된다. Victory Native에서 그나마 가장 불편한 게 범례라고 생각했는데 위치를 Bottom, TopLeft 처럼 지정하면 저절로 갖다붙는 것이 아니라 내가 위치를 지정해주어야 하는게 불편했다.
그리고 gutter라고 범례 아이템간 위치를 조정할 수 있는 옵션이 있는데 글자까지 고려한 것이 아니라서 범례 아이템간 글자수가 많이 차이나면 좀 어색한 느낌을 줄 수 있다.
<VictoryLegend
  x={80}
  y={190}
  orientation="horizontal"
  gutter={{left: 5, right: 50}}
  style={{
    border: {stroke: 'white'},
    title: {fontSize: 20},
    labels: {fontSize: 12},
  }}
  data={[
    {
      name: '실시간',
      symbol: {fill: theme.colors.pink, type: 'square'},
    },
    {
      name: '예측',
      symbol: {fill: theme.colors.lightPink, type: 'square'},
    },
    {
      name: '평균',
      symbol: {fill: theme.colors.lightPurple},
    },
  ]}
/>'차트라이브러리 > Victory Native' 카테고리의 다른 글
| [차트] Victory Native로 multi line 차트 그리기 (0) | 2021.12.21 |
|---|---|
| [Victory Native] multi line 차트 그리기 (0) | 2021.12.21 |
| [차트] Victory Native로 복합차트 만들기 (0) | 2021.12.09 |
| [차트] Victory Native로 특정값에 따라 차트스타일 바꾸기 (0) | 2021.12.09 |
| [차트] RN에서 Victory Native 설치하기 (1) | 2021.12.09 |