반응형
반응형
✔️ 필요성
여러가지 차트(Bar, Line, StackedBar)를 하나의 축 위에 겹쳐 그리고 싶을 때가 많다. (복합차트) Victory Native는 복합 차트를 그리는 것이 매우 쉽다. 해당하는 컴포넌트를 그냥 같이 겹쳐 붙이기만 하면 된다.
import React from 'react';
import styled from 'styled-components/native';
import {
  VictoryAxis,
  VictoryBar,
  VictoryChart,
  VictoryLine,
} from 'victory-native';

const Container = styled.View`
  flex: 1;
  align-items: center;
  justify-content: center;
`;

const data = [
  {x: 1, earnings: 4},
  {x: 2, earnings: 2},
  {x: 3, earnings: 1},
  {x: 4, earnings: 3},
  {x: 5, earnings: 3},
];

const barData = [
  {x: 1, y: 2},
  {x: 2, y: 3},
  {x: 3, y: 5},
  {x: 4, y: 4},
  {x: 5, y: 6},
];
const Chart = () => {
  return (
    <Container>
      <VictoryChart width={400} height={300}>
        <VictoryAxis standalone={false} />
        <VictoryLine standalone={false} data={barData} x="x" y="y" />
        <VictoryAxis
          dependentAxis
          domain={[0, 6]}
          offsetX={0}
          orientation="left"
          standalone={false}
        />
        <VictoryAxis
          dependentAxis
          offsetX={0}
          domain={[0, 6]}
          orientation="right"
          standalone={false}
        />
        <VictoryBar
          data={data}
          domain={{y: [0, 5]}}
          x="x"
          y="earnings"
          standalone={false}
        />
      </VictoryChart>
    </Container>
  );
};

export default Chart;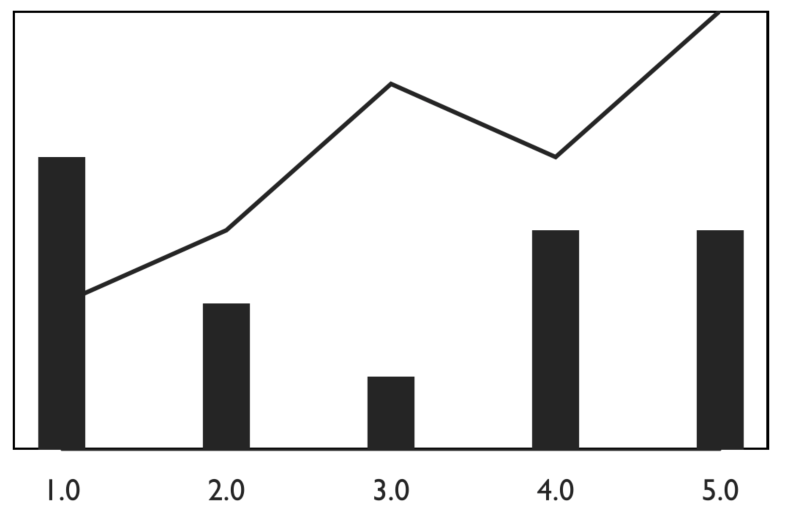
✔️ 차트간 z-index 바꾸기
Bar 차트를 그린다고 하면 모든 Bar가 같은 색상을 가진게 아니라 특정값에 따라 동적으로 차트의 스타일(색깔 등)을 바꾸고 싶을 때가 있다. 이 때는 그래프의 순서로 조정할 수 있는데 코드 상에서 아래에 그리는 그래프가 좀 더 앞으로 나오게 된다.
<VictoryChart width={400} height={300}>
        <VictoryAxis standalone={false} />
        <VictoryLine standalone={false} data={barData} x="x" y="y" />
        <VictoryAxis
          dependentAxis
          domain={[0, 6]}
          offsetX={0}
          orientation="left"
          standalone={false}
        />
        <VictoryAxis
          dependentAxis
          offsetX={0}
          domain={[0, 6]}
          orientation="right"
          standalone={false}
        />
        <VictoryStack colorScale={['tomato', 'orange', 'gold']}>
          <VictoryBar
            standalone={false}
            data={data1}
          />
          <VictoryBar
            standalone={false}
            data={data2}
          />
          <VictoryBar
            standalone={false}
            data={data3}
          />
        </VictoryStack>
</VictoryChart>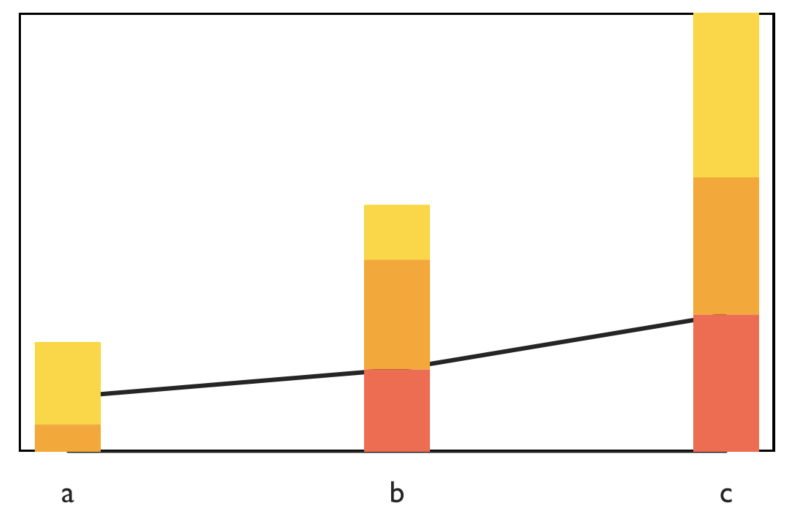
<VictoryLine/> 태그를 <VictoryStack/> 보다 아래에 위치시켰다
  <VictoryChart width={400} height={300}>
        <VictoryAxis standalone={false} />
        <VictoryAxis
          dependentAxis
          domain={[0, 6]}
          offsetX={0}
          orientation="left"
          standalone={false}
        />
        <VictoryAxis
          dependentAxis
          offsetX={0}
          domain={[0, 6]}
          orientation="right"
          standalone={false}
        />
        <VictoryStack colorScale={['tomato', 'orange', 'gold']}>
          <VictoryBar
            standalone={false}
            data={data1}
          />
          <VictoryBar
            standalone={false}
            data={data2}
          />
          <VictoryBar
            standalone={false}
            data={data3}
          />
        </VictoryStack>
        <VictoryLine standalone={false} data={barData} x="x" y="y" />
      </VictoryChart>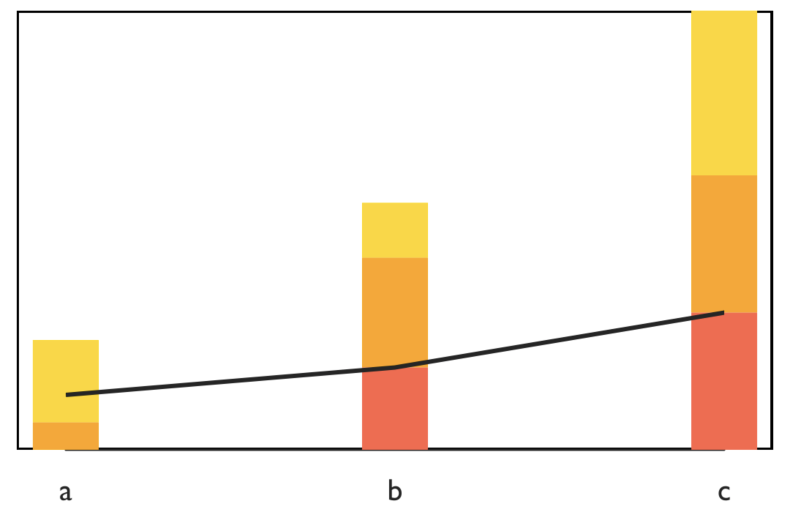
반응형
'차트라이브러리 > Victory Native' 카테고리의 다른 글
| [차트] Victory Native로 multi line 차트 그리기 (0) | 2021.12.21 |
|---|---|
| [Victory Native] multi line 차트 그리기 (0) | 2021.12.21 |
| [차트] Victory Native 활용 예제 파헤치기 (0) | 2021.12.11 |
| [차트] Victory Native로 특정값에 따라 차트스타일 바꾸기 (0) | 2021.12.09 |
| [차트] RN에서 Victory Native 설치하기 (1) | 2021.12.09 |