반응형
✔️ 필요성
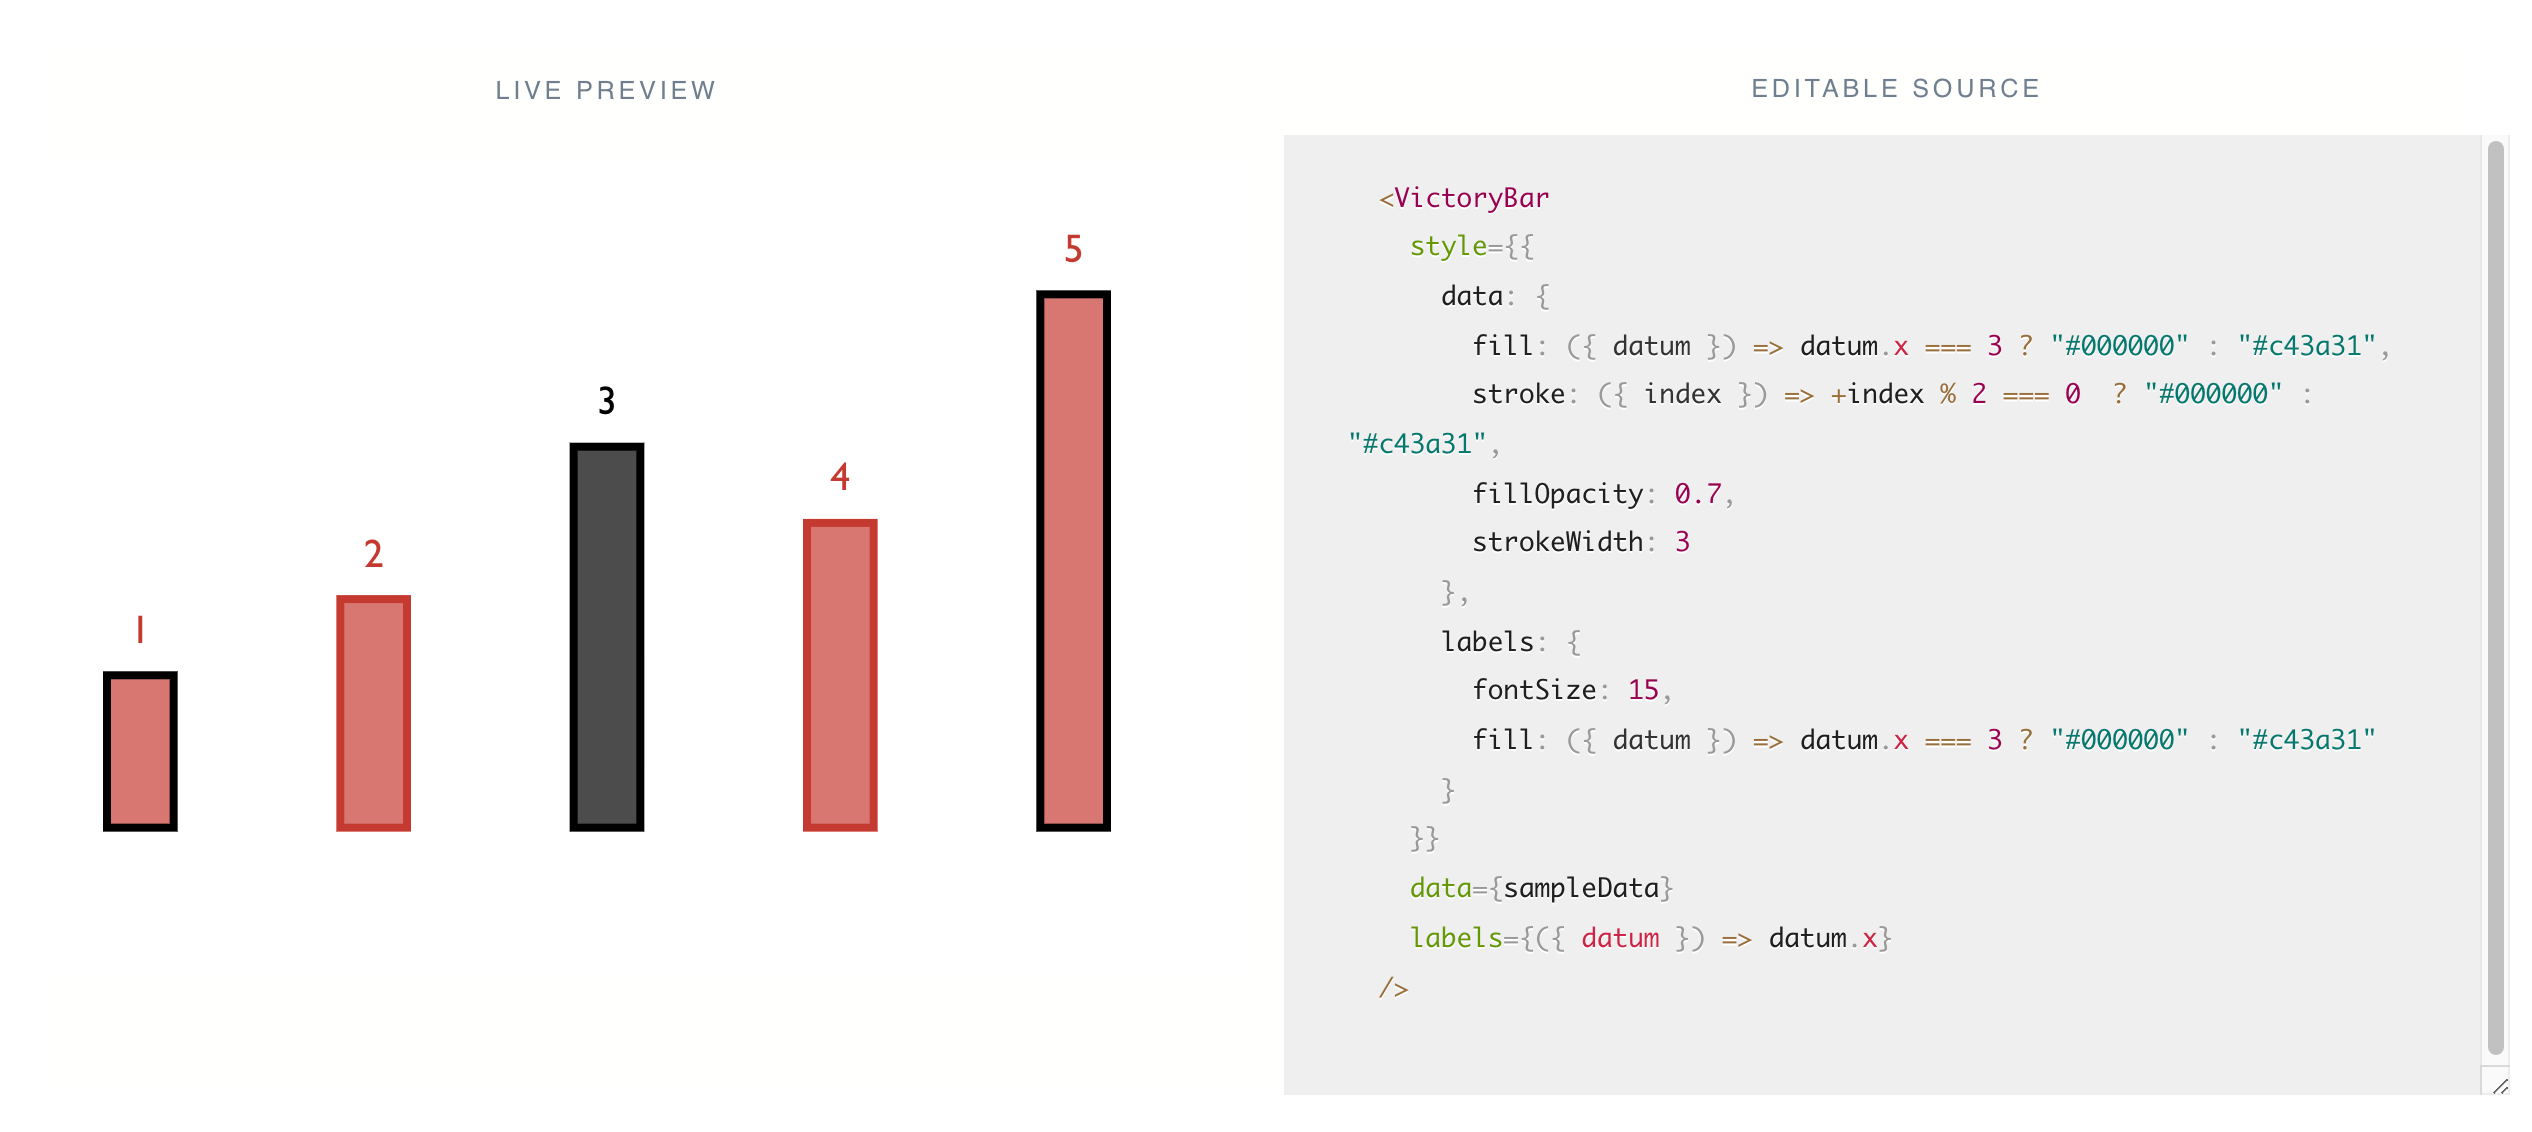
Bar 차트를 그린다고 하면 모든 Bar가 같은 색상을 가진게 아니라 특정값에 따라 동적으로 차트의 스타일(색깔 등)을 바꾸고 싶을 때가 있다.
https://formidable.com/open-source/victory/docs/common-props/#style
Victory | Common Props
Not every component uses all of these props. These are all common to things like VictoryBar, VictoryScatter, but other components like VictoryStack use only some of them. The props explanations given here are general. Each component docs page should be con
formidable.com
✔️ x 혹은 y축 값에 따라 바꾸기
x값에 대한 함수로 fill/stroke 항목을 채우면 된다. fill은 전체 색상을 의미하고 stroke는 테두리를 의미한다.
이 때 x와 y props로 x, y 값에 대한 명시적인 이름이 들어가있으면 datum.x가 작동하지 않는다. 이 때는 사용했던 이름을 동일하게 사용해야 한다. 아래 코드를 참고하자!
import React from 'react';
import styled from 'styled-components/native';
import {VictoryBar, VictoryChart, VictoryTheme} from 'victory-native';

const data = [
  {quarter: 1, earnings: 13000},
  {quarter: 2, earnings: 16500},
  {quarter: 3, earnings: 14250},
  {quarter: 4, earnings: 19000},
];

const Container = styled.View`
  flex: 1;
  align-items: center;
  justify-content: center;
  background-color: #f2f2f2;
`;

const Chart = () => {
  return (
    <Container>
      <VictoryChart width={300} height={200}>
        <VictoryBar
          data={data}
          cornerRadius={{top: 4}}
          x="quarter"
          y="earnings"
          style={{
            data: {
              fill: ({datum}) => (datum.quarter > 3 ? 'green' : '#c43a31'),
            },
          }}
        />
      </VictoryChart>
    </Container>
  );
};

export default Chart;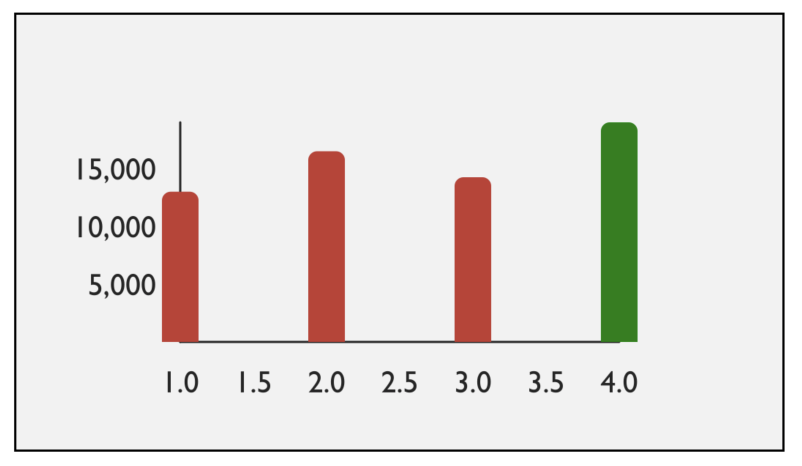
✔️ x 혹은 y축 값이 아닌 다른 값에 따라 바꾸기
x, y축 값이 아닌 다른 특정 값에 따라 차트 스타일을 바꾸고 싶을 때에는 우선 data에 해당 값을 넣은 다음에 style props에서 함수로 사용하면 된다.
import React from 'react';
import styled from 'styled-components/native';
import {VictoryBar, VictoryChart} from 'victory-native';

const data = [
  {quarter: 1, earnings: 13000, level: 1},
  {quarter: 2, earnings: 16500, level: 2},
  {quarter: 3, earnings: 14250, level: 3},
  {quarter: 4, earnings: 19000, level: 4},
];

const Container = styled.View`
  flex: 1;
  align-items: center;
  justify-content: center;
  background-color: #f2f2f2;
`;

const Chart = () => {
  return (
    <Container>
      <VictoryChart width={300} height={200}>
        <VictoryBar
          data={data}
          cornerRadius={{top: 4}}
          x="quarter"
          y="earnings"
          labels={({datum}) => datum.x}
          style={{
            // level 값에 따라 차트 스타일 바꾸기
            data: {
              fill: ({datum}) => (datum.level > 1 ? 'green' : '#c43a31'),
            },
          }}
        />
      </VictoryChart>
    </Container>
  );
};

export default Chart;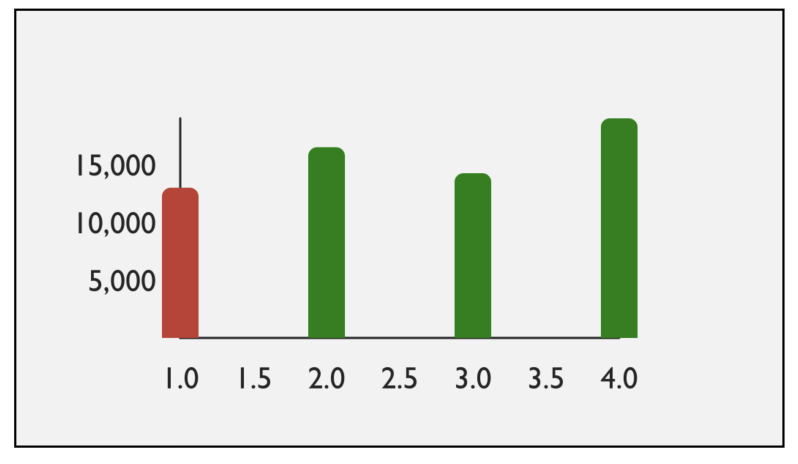
반응형
'차트라이브러리 > Victory Native' 카테고리의 다른 글
| [차트] Victory Native로 multi line 차트 그리기 (0) | 2021.12.21 |
|---|---|
| [Victory Native] multi line 차트 그리기 (0) | 2021.12.21 |
| [차트] Victory Native 활용 예제 파헤치기 (0) | 2021.12.11 |
| [차트] Victory Native로 복합차트 만들기 (0) | 2021.12.09 |
| [차트] RN에서 Victory Native 설치하기 (1) | 2021.12.09 |