반응형
import styled from '@emotion/styled';
import React from 'react';
import { VictoryChart, VictoryScatter, VictoryBar, VictoryAxis, VictoryLabel, VictoryContainer } from 'victory';
import { ReactComponent as Svg1} from "./svg/file1.svg";
import { ReactComponent as Svg2} from "./svg/file2.svg";
import { ReactComponent as Svg3} from "./svg/file3.svg";
import { ReactComponent as Svg4} from "./svg/file4.svg";
import { ReactComponent as Svg5} from "./svg/file5.svg";
import { ReactComponent as Svg6} from "./svg/file6.svg";


const Container = styled.div`
    width: 900px;
    height: 600px;
    background-color: #F7FAFF;
    display: flex;
    align-items: center;
    justify-content: center;
`

const AddSvg = ({ x, y, datum } : any) => {
  const Icon = ({type}:any) => {
    if (type === '음식점') return <Svg1/>
    if (type === '학원') return <Svg2/>
    if (type === '의원') return <Svg3/>
    if (type === '미용실') return <Svg4/>
    if (type === '부동산') return <Svg5/>
    if (type === '카페') return <Svg6/>
    return <></>
  }
  if ( datum.y === 0 ) return <></>;
  return <svg x={x-26} y={y-120}><Icon type={datum.x}/></svg>
};

const Rect = styled.rect`
`;

const Victory = () => {
  const data = [
    { x: " ", y: 0, fontColor: 'transparent'},
    { x: "음식점", y: 21.4, color: "#0C8BFF", dy:-32 },
    { x: "학원", y:8.8, color: "#0C8BFF", dy:-32 },
    { x: "의원", y: 5.9, color: "#0C8BFF" , dy:-32},
    { x: "미용실", y: 3.9, color: "#A6D4FF", dy:-32 },
    { x: "부동산", y: 3.0, color: "#A6D4FF", dy:-32 },
    { x: "카페", y: 2.3, color: "#A6D4FF", dy:-32 },
    { x: "  ", y: 0, fontColor: 'transparent' }
  ];

  return (
    <Container className='Container'>
        <VictoryChart domainPadding={{ x: 0, y: 80}} width={860} height={520} containerComponent={<VictoryContainer responsive={false}/>}>
        <VictoryAxis crossAxis
            width={500}
            style={{
                ticks: {stroke: "grey", size: (props:any) => { if(props.index === 0 || props.index === 7) return 0; return 5}},
                tickLabels: {fontSize: 20, padding: 14}
            }}
        />
        <VictoryBar
            barRatio={0.6}
            alignment="middle"
            style={{
                data: { fill: ({ datum }) => datum.color },
            }}
            data={data}
            labels={({ datum }) => datum.y}
            labelComponent={
              <VictoryLabel
                className="myLabel"
                dy={-28}
                style={{
                  fill: (props:any) => {
                    if (props.datum.y === 0) return 'transparent';
                    if (props.datum.color === "#0C8BFF" ) return 'white';
                    return "#0C8BFF";
                  },
                  fontWeight: (props:any) => {
                    if (props.datum.color === "#0C8BFF" ) return '600';
                    return '300';
                  },
                  fontSize: '24',
                }}
                backgroundStyle={{
                  fill: (props: any) => {
                    if (props.datum.y === 0) return 'transparent';
                    if (props.datum.color === "#A6D4FF" ) return 'transparent';
                    return props.datum.color;
                  },
                }}
                backgroundPadding={10}
                backgroundComponent={<Rect id={'id'} rx={6} transform="translate(0 -2)"/>}
                data={data}
                text={({ datum }) => `${datum.y}%`}
              />
            }
        />
        <VictoryScatter
            data={data}
            dataComponent={<AddSvg />}
            />
        </VictoryChart>
    </Container>

  );
}

export default Victory;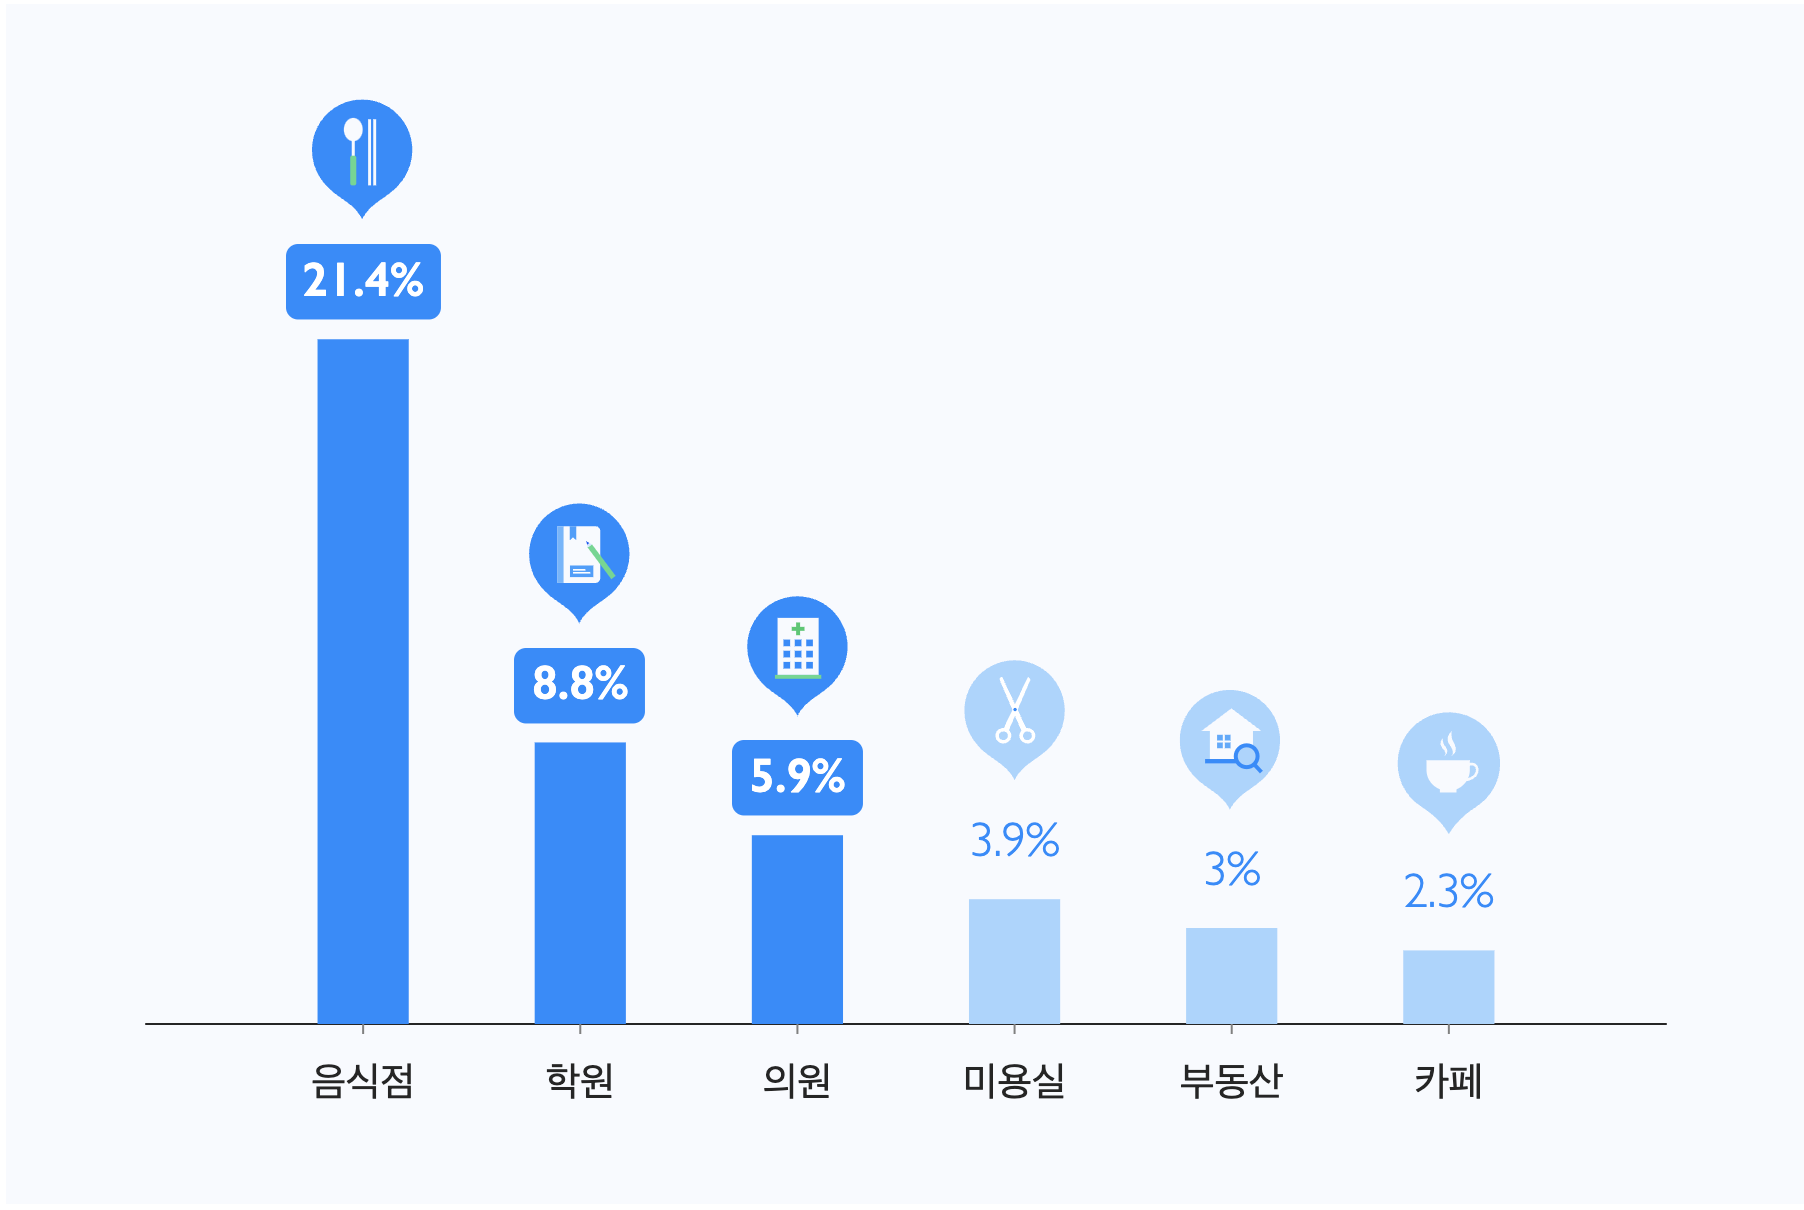
이틀 갈아넣어서 만든 VictoryChart...
완벽하진 않지만 상당히 자유도가 높은 편인 것 같다
반응형
'차트라이브러리 > Victory Native' 카테고리의 다른 글
| [차트] Add SVG on Victory Chart (0) | 2023.04.28 |
|---|---|
| [차트] Victory / 'VictoryScatter'은(는) JSX 구성 요소로 사용할 수 없습니다. (0) | 2023.04.28 |
| [차트] Victory Native Axis 꾸미기 (0) | 2021.12.21 |
| [차트] Victory Native로 multi line 차트 그리기 (0) | 2021.12.21 |
| [Victory Native] multi line 차트 그리기 (0) | 2021.12.21 |