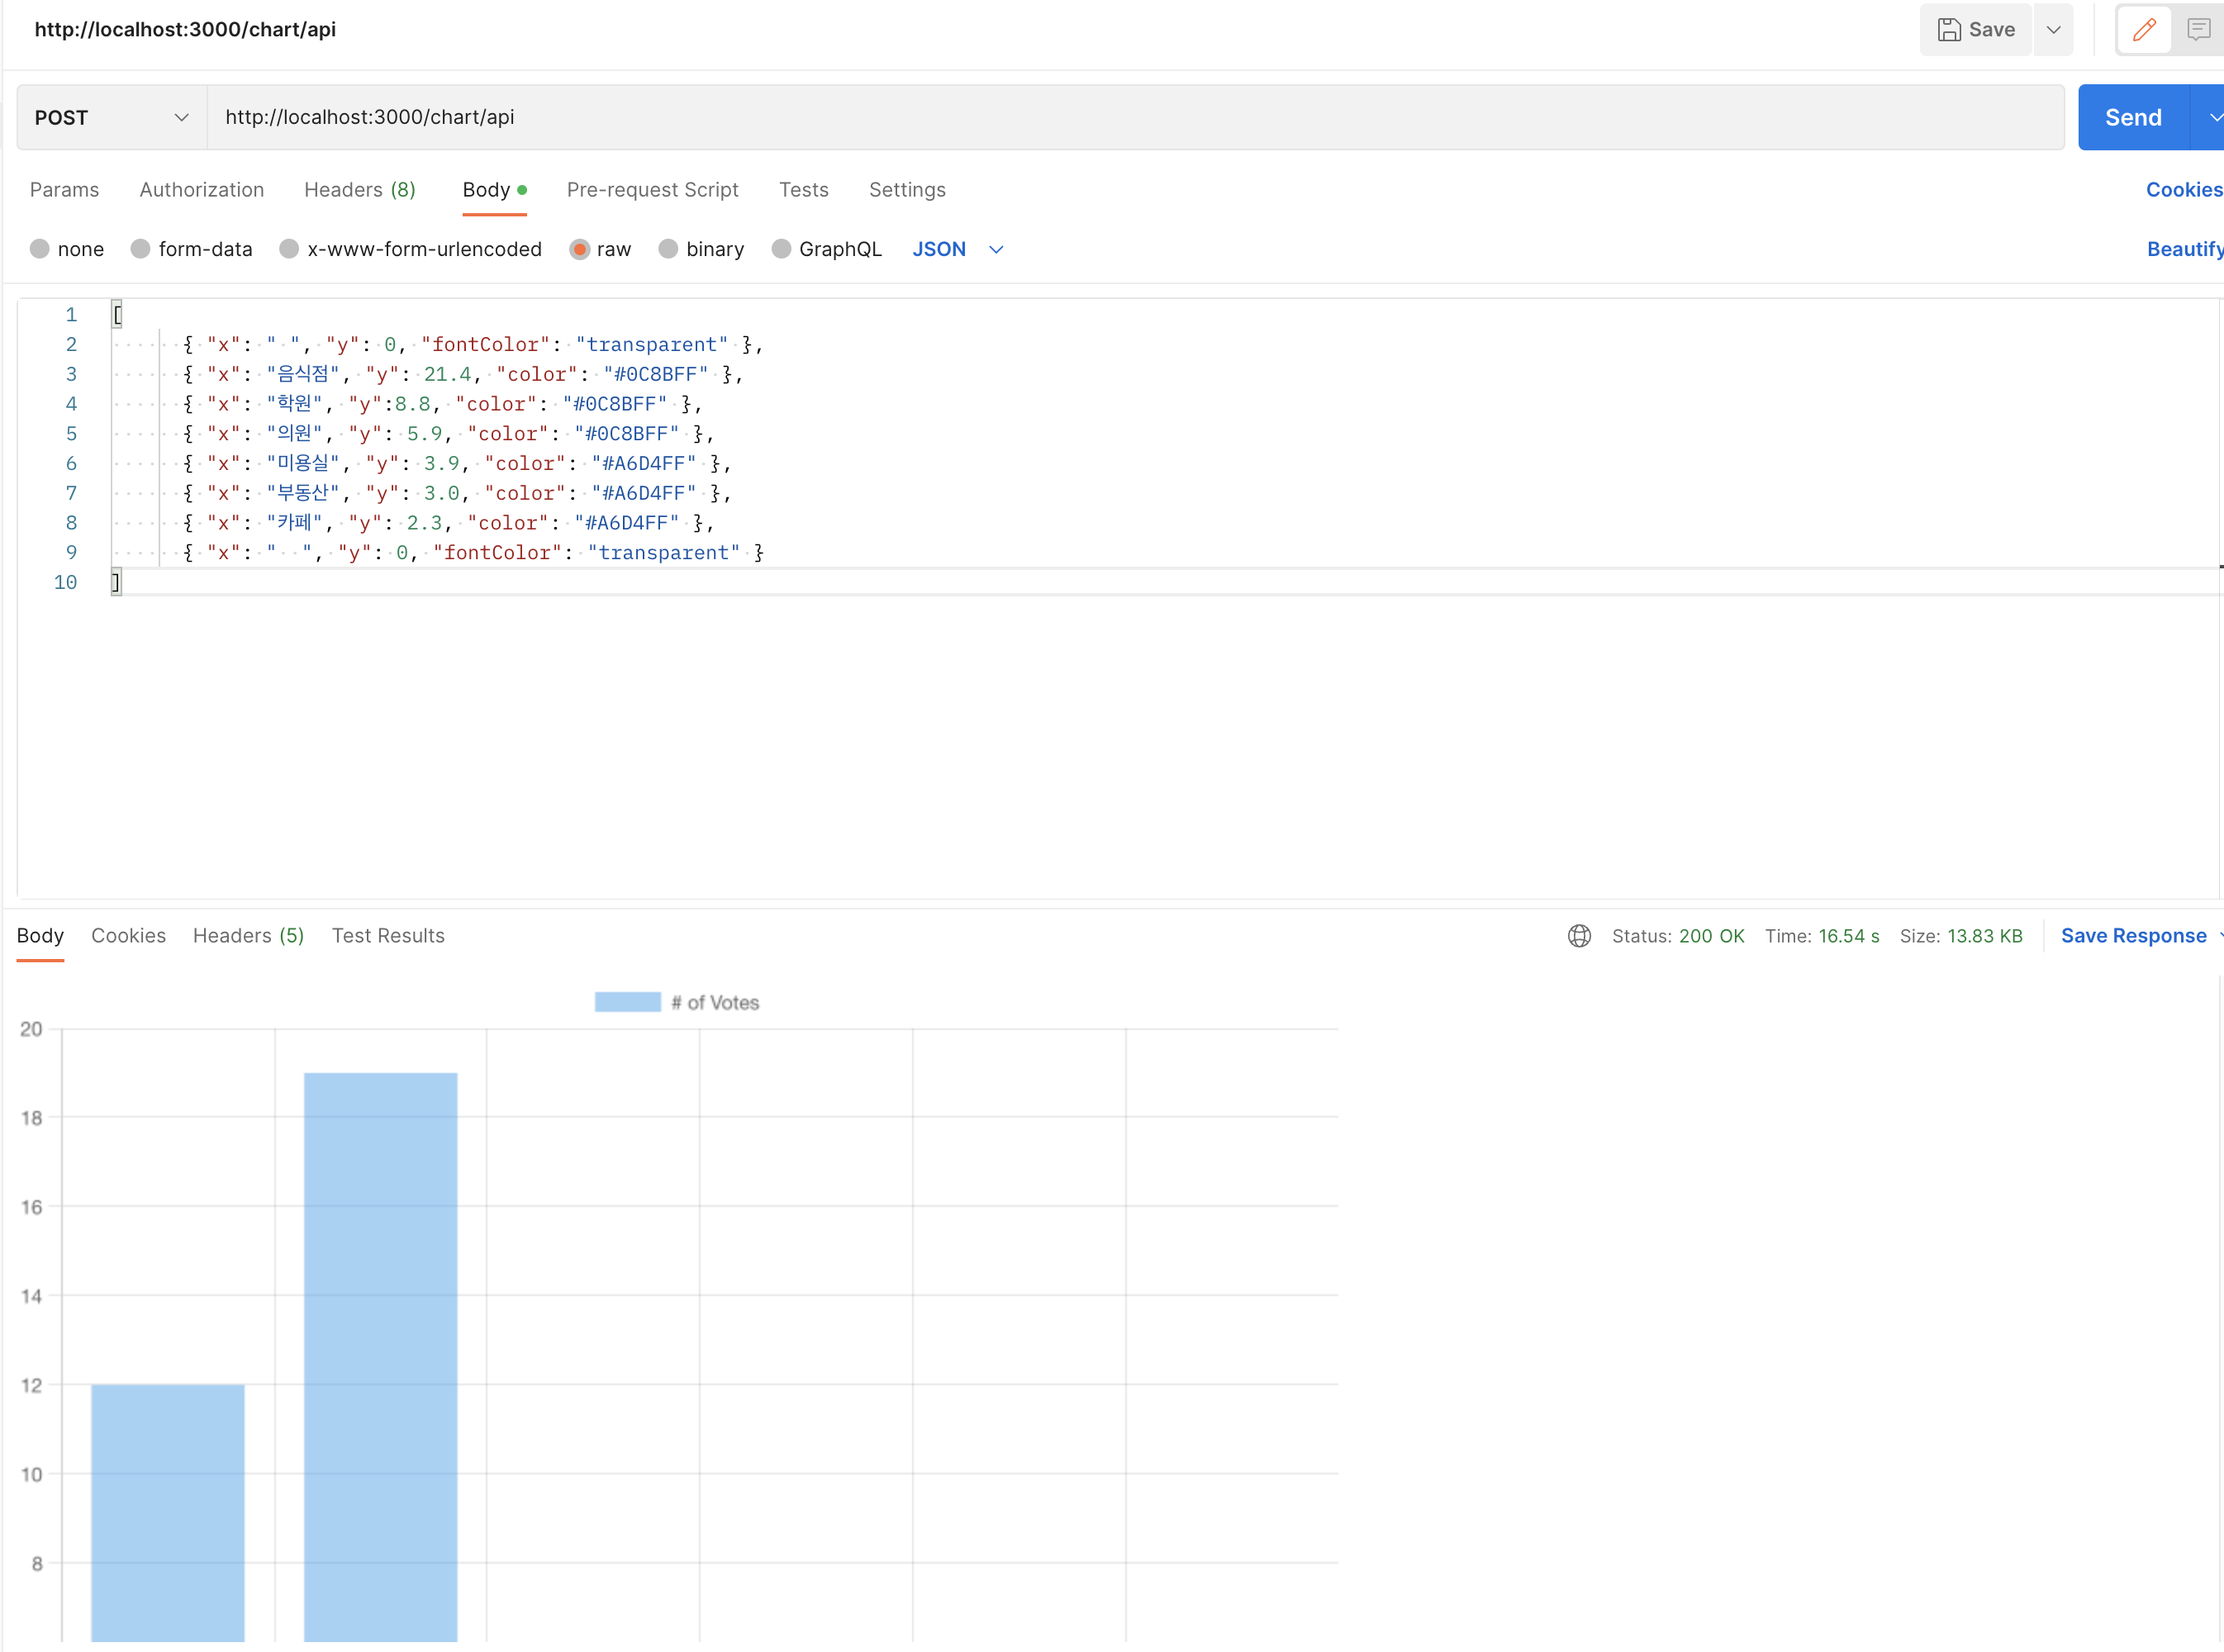
반응형
import { NextResponse } from "next/server";
import { createCanvas } from 'canvas';
import Chart, { ChartConfiguration } from 'chart.js/auto';


export async function GET() {
    const data = {
        pokemon: {
            name: '꼬부기'
        }
    }
    return NextResponse.json({ data });
}


export async function POST(request: Request, response: Response) {
    const data = await request.json();
    console.log('req', data);

    const canvas = createCanvas(800, 600);
    const ctx: any = canvas.getContext('2d');

    const chartConfig: ChartConfiguration = {
        type: 'bar',
        data: {
          labels: ['Red', 'Blue', 'Yellow', 'Green', 'Purple', 'Orange'],
          datasets: [
            {
                label: '# of Votes',
                data: [12, 19, 3, 5, 2, 3]
            }
          ]
        },
        options: {
          responsive: false,
          plugins: {
            legend: {
              position: 'top'
            }
          }
        }
    };
    const chart = new Chart(ctx, chartConfig);
    const imageData = canvas.toBuffer();

    return new NextResponse(imageData, {
        status: 200,
        headers: { 'Content-Type': 'image/png' },
    })
}
import { NextResponse } from "next/server";
import { NextApiHandler } from 'next';
import { createCanvas } from 'canvas';
import Chart, { ChartConfiguration } from 'chart.js/auto';


const handler: NextApiHandler = async (req, res) => {
    if (req.method === 'GET') {
        const data = {
            pokemon: {
                name: '꼬부기'
            }
        }
        res.status(200).json({ data: data })
    }

    if (req.method === 'POST') {
        const canvas = createCanvas(800, 600);
        const ctx: any = canvas.getContext('2d');

        const chartConfig: ChartConfiguration = {
            type: 'bar',
            data: {
            labels: ['Red', 'Blue', 'Yellow', 'Green', 'Purple', 'Orange'],
            datasets: [
                {
                    label: '# of Votes',
                    data: [12, 19, 3, 5, 2, 3]
                }
            ]
            },
            options: {
            responsive: false,
            plugins: {
                legend: {
                position: 'top'
                }
            }
            }
        };
        const chart = new Chart(ctx, chartConfig);
        const imageData = canvas.toBuffer();

        res.writeHead(200, {
            'Content-Type': 'image/png',
          });
        res.end(imageData);
    }
};

export default handler;
반응형
'프론트엔드 웹 > Next' 카테고리의 다른 글
| [Next] Victory Chart를 png 파일로 만들어서 Return 하는 Next.js API 만들기 (0) | 2023.05.24 |
|---|---|
| [Next] DOM(화면에 나타났을 때) animation CSS + 강제 re-render (0) | 2023.05.19 |
| [Next] Next.13에서 API Route 사용하기 (0) | 2023.05.08 |
| 외부 URL에 새창으로 이동하기 (useRouter, window.location, window.open) (0) | 2022.06.28 |
| openssl로 Next.js HTTPS 적용하기 (0) | 2022.04.28 |