반응형

✔️ 필요성
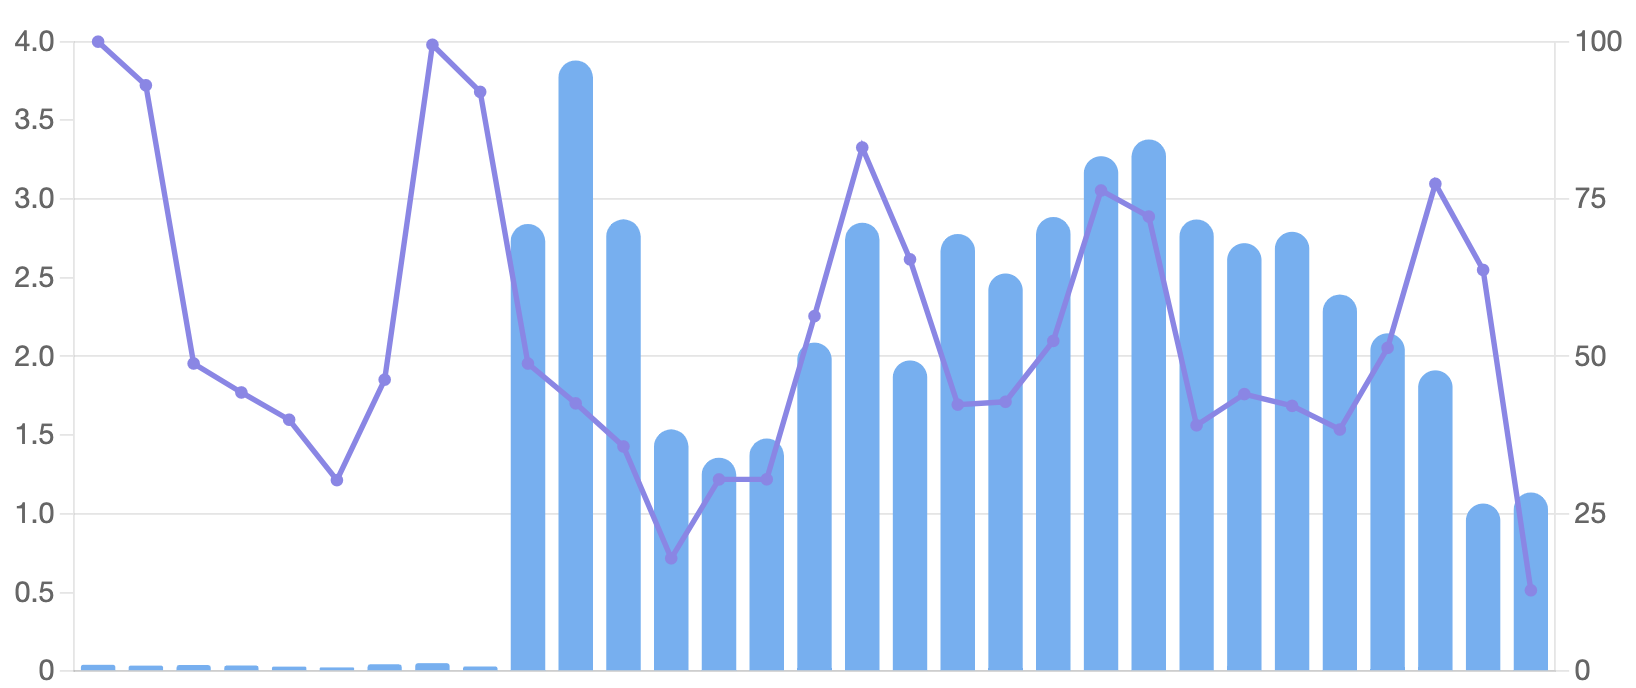
바 차트와 라인 차트가 혼합된 멀티 차트에서 이번에는 양쪽 y축을 함께 사용하는 multi Axis까지 활용해보고자 한다
✔️ 문제 해결
해당 예제를 동일하게 잘 따라하면 된다 ㅎ
https://react-chartjs-2.js.org/examples/multiaxis-line-chart
Multiaxis Line Chart | react-chartjs-2
Example of multiaxis line chart in react-chartjs-2.
react-chartjs-2.js.org
scales에 y와 y1을 만든 다음에 (이름은 달라도 된다) datasets에서 yAxisID에 해당 축이름을 기재해주면 된다. grid나 ticks 옵션을 적절하게 사용하면 내가 원하는대로 조정이 가능하다.
const Chart = ({ data }: Props) => {
  const chartRef = useRef<any>(null);

  const dataset = {
    labels: labelsData,
    datasets: [
      {
        type: "line" as const,
        data: lineData,
        borderColor: theme.colors.point8C,
        backgroundColor: theme.colors.point8C,
        hoverBackgroundColor: theme.colors.chart0C,
        yAxisID: "y1",
      },
      {
        type: "bar" as const,
        data: barData,
        borderColor: theme.colors.chart67,
        backgroundColor: theme.colors.chart67,
        borderRadius: 10,
        hoverBackgroundColor: theme.colors.chart0C,
        yAxisID: "y",
      },
    ],
  };

  const options = {
    scales: {
      xAxes: {
        ticks: {
          autoSkip: true,
          maxRotation: 90,
          minRotation: 90,
          labelOffset: 4,
          padding: 4,
          font: {
            size: 16,
          },
        },
        grid: {
          display: false, //뒷배경 라인 없애기
        },
      },
      x: {
        display: false, //하단 라인을 없애기
        ticks: {
          display: false, //새로운tick을 만들었으니 기존의 tick을 제거
        },
      },
      y: {
        type: "linear" as const,
        display: true,
        position: "left" as const,
        grid: {
          drawOnChartArea: false,
        },
        ticks: {
          font: {
            size: 16,
          },
        },
      },
      y1: {
        type: "linear" as const,
        display: true,
        position: "right" as const,
        suggestedMin: 0,
        suggestedMax: 100,
        ticks: {
          stepSize: 25,
          font: {
            size: 16,
          },
        },
      },
    },
  };

  return (
    <Container>
      <Chart
        type="bar"
        options={options}
        data={dataset}
        ref={chartRef}
      />
    </Container>
  );
};
반응형
'차트라이브러리 > Chart.js' 카테고리의 다른 글
| Chart.js Canvas Resize 차트 크기 바꾸기 (0) | 2022.03.24 |
|---|---|
| Chart.js x축 값에 따라 다양하게 설정하기 dynamic Tick Color (0) | 2022.03.17 |
| Chart.js Axis label 만들기 (0) | 2022.03.17 |
| LineChart에서 포인트 없애기 (Remove Point from LineChart) (0) | 2022.03.17 |
| [에러해결] Error: "point" is not a registered element. (0) | 2022.03.17 |